Insights
This function visualizes data such as room temperature sensors and power consumption on a daily and monthly basis, supporting facility operation monitoring and energy saving.
Log in to the AIRSTAGE Cloud and display the App hub screen.

Click (a) to go to Insights.
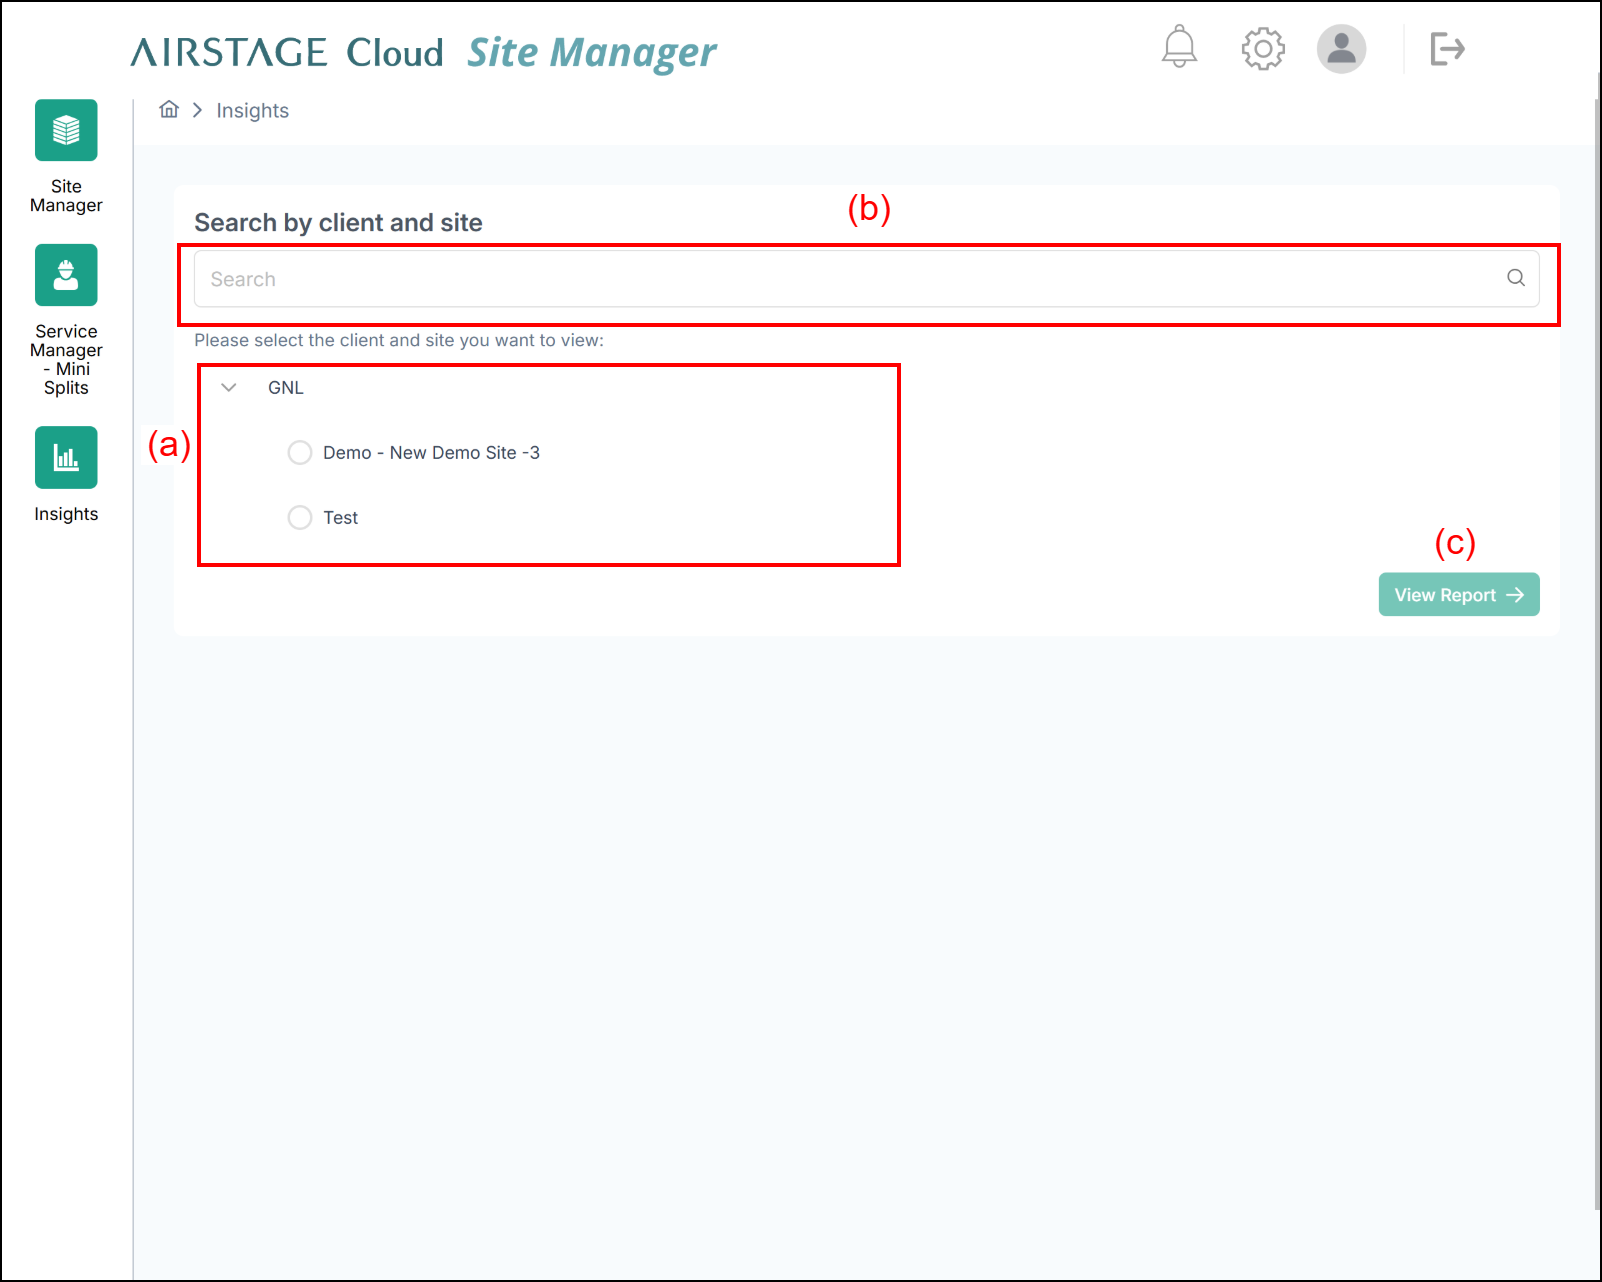
(a) Select the site you want to check.
(b) As you type, the list of Site suggestions is narrowed down, making it easier to search.
(c) [Continue] button
After selecting the Site you want to check in (a), press button (c).
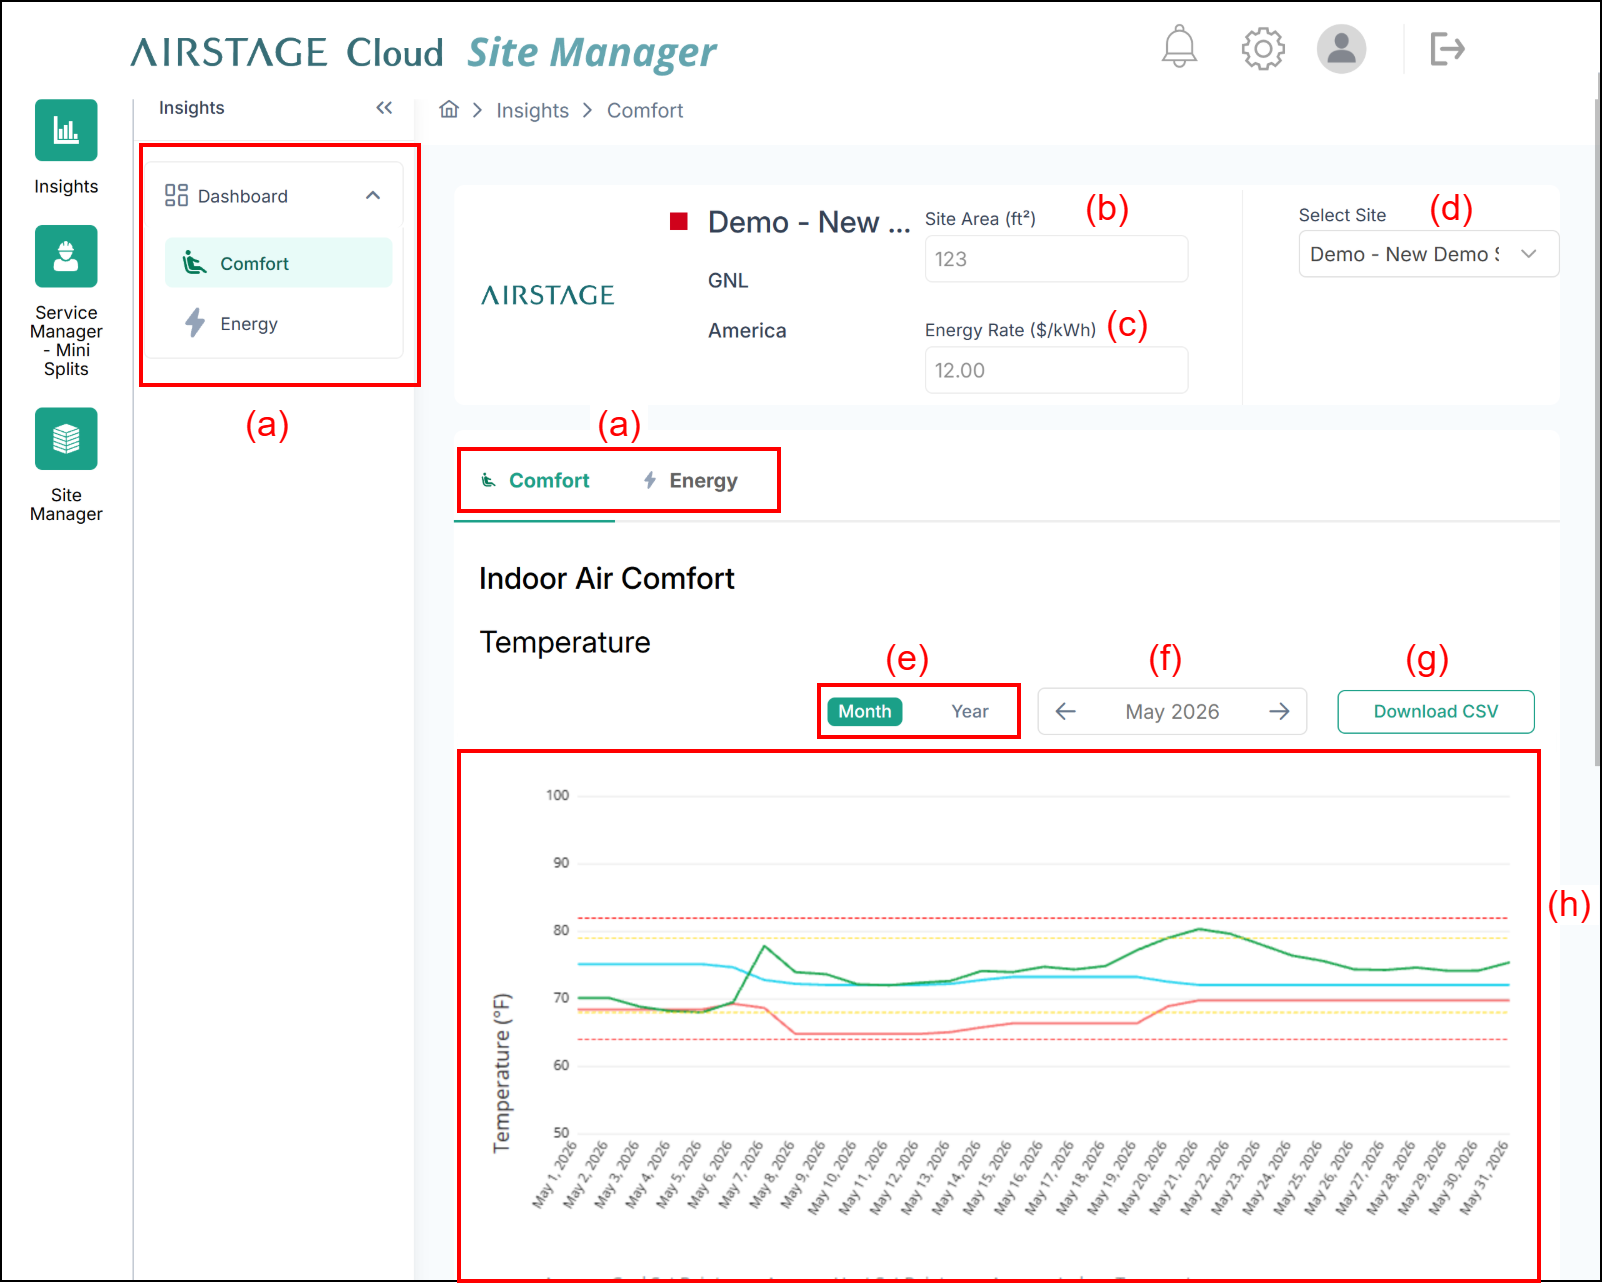
(a) Select Comfort or Energy to display the corresponding trend graph.
| Comfort | A trend graph of room temperature and relative humidity is displayed. |
| Energy | Trend graphs of Use Intensity, Energy Use and Energy Cost (*1) are displayed. *1: To display Energy Cost, the Energy rate must be entered. |
(b) Enter the size of the site. The unit can be changed in "Check or change the Site settings".
(c) Enter the energy rate. This is required to display energy consumption.
(d) The site can be selected.
(e) Measurement Period Selection Button
The unit of a graph’s x-axis can be changed to month/year.
(f) Date setting
Select a date on the calendar, and the information for the set date and time will be displayed on the graph screen.
(g) Download CSV button
The data will be exported as a CSV file.
(h) Trend graph
A trend graph of the item selected in (a) is displayed. Placing the cursor over the graph shows the value at that time.